pyrunplotter
pyrunplotter.py is a Python3 script intended to be used for comparing the difference between multiple runs. It is intended to be used in conjunction with multiresolution_multirun_table to compare differences between models used in a multiresolution context. Plots can be generated of platform positions, sensor parameters such as SNR, and simulation level quantities such as platform counts. Several demos (listed below) illustrate its usage.
This script uses pymystic to parse event files generated by Mission and depends on numpy and matplotlib (> 3.4.0).
API Documentation
-
class
pyrunplotter.Analyzer(filePattern, endTime=None)¶ This class is responsible for taking in a file or list of files and plotting data based on the file contents
-
plotAltitudeVsTime(platformList, runNumberList=[1], pyplot_axis=None)¶ Plots the altitudes of each platform side-by-side in a 3D plot
-
plotAmmoQuantityVsTime(platformComponentList, runNumberList=[1], pyplot_axis=None)¶ Plots the ammo quantity of each platform/component pair
-
plotComparisonAltitude(baseline, comparison, pyplot_axis=None)¶ Plots relative altitudes between [baseline] and [comparison]
- Parameters:
- baseline2-tuple (string, int)
2-tuple of the form (name, runNumber), e.g. (‘mr_mover_red’, 1)
- comparison2-tuple (string, int)
2-tuple of the form (name, runNumber), e.g. (‘mr_mover_red’, 2)
- pyplot_axis: matplotlib.pyplot.axes
If included, will plot on an existing graph. Use this to plot multiple comparisons on the same graph
-
plotComparisonDistance(baseline, comparison, pyplot_axis=None)¶ Plots the distance between [baseline] and [comparison]
- Parameters:
- baseline2-tuple (string, int)
2-tuple of the form (name, runNumber), e.g. (‘mr_mover_red’, 1)
- comparison2-tuple (string, int)
2-tuple of the form (name, runNumber), e.g. (‘mr_mover_red’, 2)
- pyplot_axis: matplotlib.pyplot.axes
If included, will plot on an existing graph. Use this to plot multiple comparisons on the same graph
-
plotComparisonFuelLevels(baseline, comparison, pyplot_axis=None)¶ Plots the fuel levels between [baseline] and [comparison]
- Parameters:
- baseline2-tuple (string, int)
2-tuple of the form (name, runNumber), e.g. (‘mr_mover_red’, 1)
- comparison2-tuple (string, int)
2-tuple of the form (name, runNumber), e.g. (‘mr_mover_red’, 2)
- pyplot_axis: matplotlib.pyplot.axes
If included, will plot on an existing graph. Use this to plot multiple comparisons on the same graph
-
plotComparisonPixelCount(baseline, comparison, pyplot_axis=None)¶ Plots the relative pixel count between [baseline] and [comparison]
- Parameters:
- baseline4-tuple (string, string, string, int)
4-tuple of the form (sensorPlatform, sensorName, targetPlatform, runNumber), e.g. (‘irst_sensor’, ‘sensor_irst’, ‘fighter_multi’, 1)
- comparison4-tuple (string, string, string, int)
4-tuple of the form (sensorPlatform, sensorName, targetPlatform, runNumber), e.g. (‘irst_sensor’, ‘sensor_irst’, ‘fighter_multi’, 2)
- pyplot_axis: matplotlib.pyplot.axes
If included, will plot on an existing graph. Use this to plot multiple comparisons on the same graph
-
plotComparisonProbabilityOfDetection(baseline, comparison, pyplot_axis=None)¶ Plots the relative probability of detection between [baseline] and [comparison]
- Parameters:
- baseline4-tuple (string, string, string, int)
4-tuple of the form (sensorPlatform, sensorName, targetPlatform, runNumber), e.g. (‘irst_sensor’, ‘sensor_irst’, ‘fighter_multi’, 1)
- comparison4-tuple (string, string, string, int)
4-tuple of the form (sensorPlatform, sensorName, targetPlatform, runNumber), e.g. (‘irst_sensor’, ‘sensor_irst’, ‘fighter_multi’, 2)
- pyplot_axis: matplotlib.pyplot.axes
If included, will plot on an existing graph. Use this to plot multiple comparisons on the same graph
-
plotComparisonSignalToNoise(baseline, comparison, pyplot_axis=None)¶ Plots the relative signal-to-noise ratio between [baseline] and [comparison]
- Parameters:
- baseline4-tuple (string, string, string, int)
4-tuple of the form (sensorPlatform, sensorName, targetPlatform, runNumber), e.g. (‘irst_sensor’, ‘sensor_irst’, ‘fighter_multi’, 1)
- comparison4-tuple (string, string, string, int)
4-tuple of the form (sensorPlatform, sensorName, targetPlatform, runNumber), e.g. (‘irst_sensor’, ‘sensor_irst’, ‘fighter_multi’, 2)
- pyplot_axis: matplotlib.pyplot.axes
If included, will plot on an existing graph. Use this to plot multiple comparisons on the same graph
-
plotFuelLevels(platformList, runNumberList=[1], pyplot_axis=None)¶ Plots the fuel levels of each platform in [platformList]
-
plotPixelCount(sensorPlatform, sensorName, targetPlatform, runNumberList=[1], pyplot_axis=None)¶ Plots pixel count from a sensor to a target over time, if applicable
-
plotPlatformCounts(runNumberList=[1], colorList=None, stackplot=False, pyplot_axis=None)¶ Creates a (optionally) stacked plot of the number of platforms of each side over the simulation’s time
-
plotPosition2D(platformList, plotWaypoints=True, runNumberList=[1])¶ Takes a list of platforms and, optionally, a list of run numbers, and plots each platform from each run in a 2D position plot
-
plotPosition3D(platformList, plotWaypoints=True, runNumberList=[1])¶ Takes a list of platforms and, optionally, a list of run numbers, and plots each platform from each run in a 3D position plot
-
plotProbabilityOfDetection(sensorPlatform, sensorName, targetPlatform, runNumberList=[1], pyplot_axis=None)¶ Plots probability of detection from a sensor to a target over time, if applicable
-
plotSignalToNoise(sensorPlatform, sensorName, targetPlatform, runNumberList=[1], pyplot_axis=None)¶ Plots signal-to-noise ratio from a sensor to a target over time, if applicable
-
processFile(endTime=None)¶ Called to process either a single file or a group of files, depending on how Analyzer is initialized
-
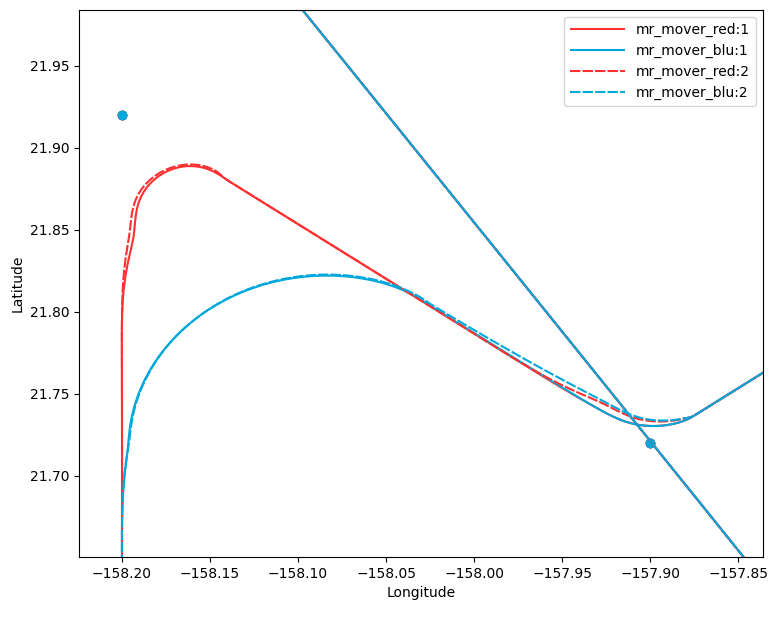
demo-plot2dPosition.py
This example script will plot the positions of 4 platforms, as well as their route’s waypoints, on a 2D graph by their latitude and longitude.
Output will look like this:
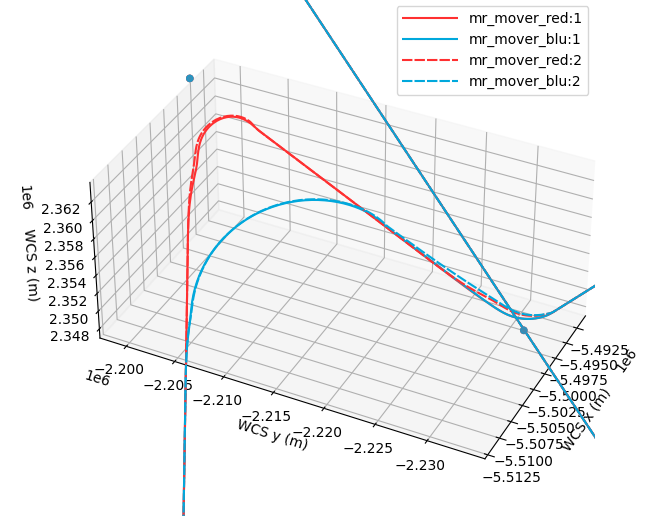
demo-plot3dPosition.py
This example will plot the same positions as the example above, but in 3D based on their WCS coordinates.
Output will look like this:
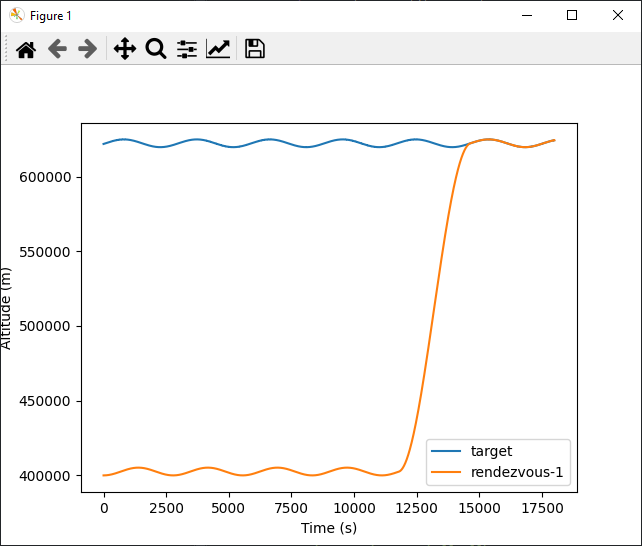
demo-plotAltitude.py
This example will plot the altitude of 2 satellites over time.
Output will look like this:
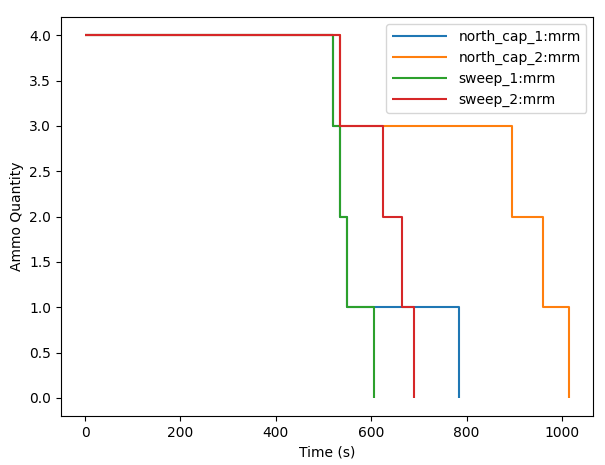
demo-plotAmmoQuantity.py
This example will plot the ammo quantity of 4 different weapons against time.
Output will look like this:
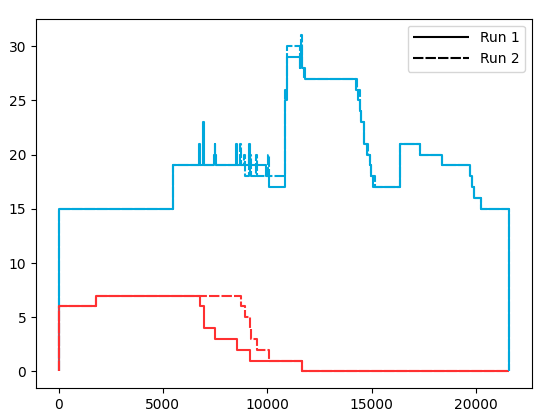
demo-plotPlatformCounts.py
This example will create a stacked plot of the number of platforms on each side over time. The colors on the graph correspond to the side of the platform.
Output will look like this:
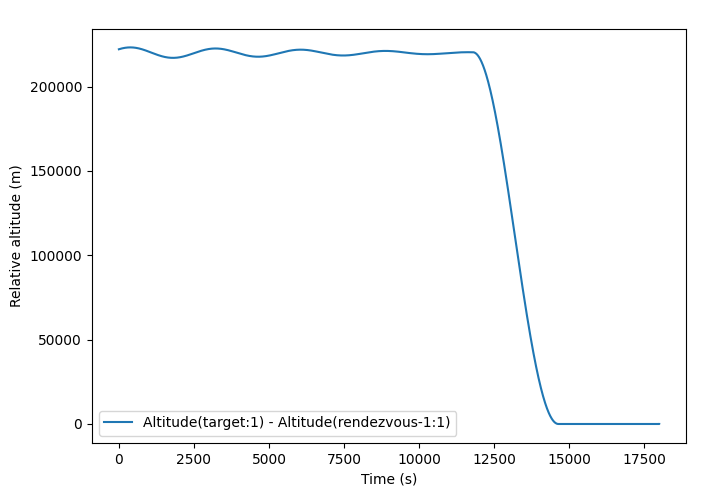
demo-compareAltitude.py
This example will show the relative altitudes of the platforms shown in demo-plotAltitude.py above.
Output will look like this:
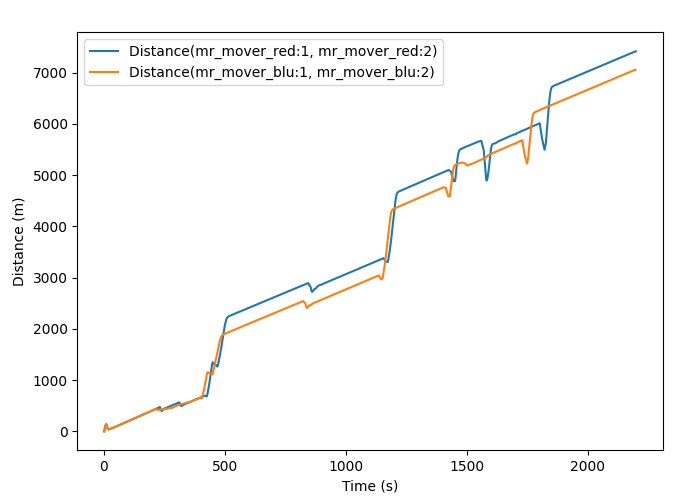
demo-compareDistance.py
This example will show the distances between platforms which follow the same route but use different flight models.
Output will look like this:
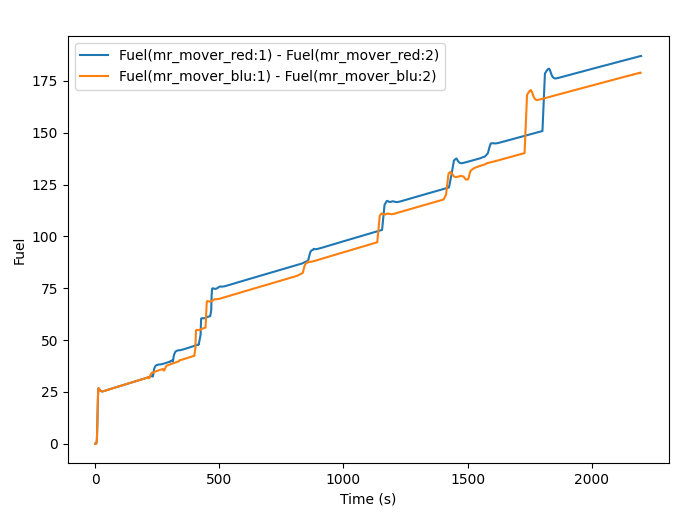
demo-compareFuelLevels.py
This example will show the relative fuel levels between the same platforms as the previous example.
Output will look like this:
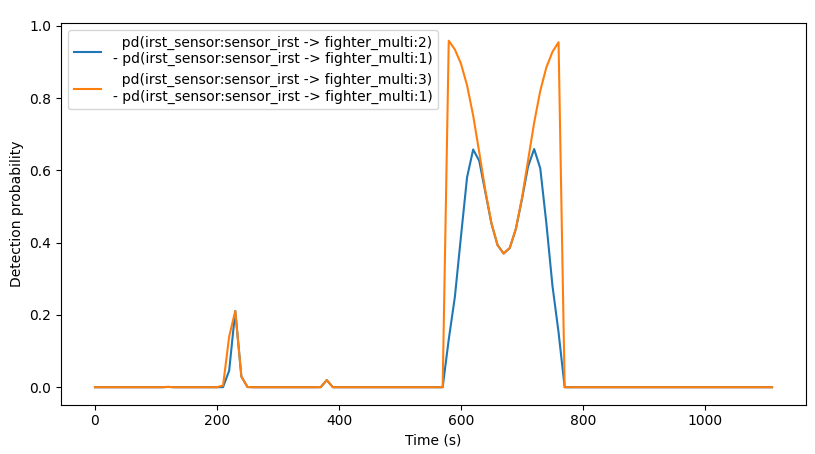
demo-compareOpticalSignatureDetection.py
This example will show the difference between detection probabilities for 3 different signatures. This uses one of the signatures as a base and compares the other 2 signatures against the base.
Output will look like this: