Relative Geometry - Mystic
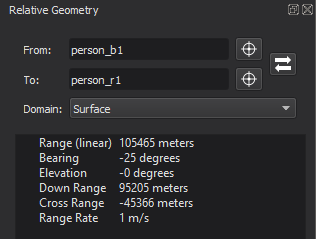
The relative geometry panel shows spatial relationships between a pair of selected platforms. To use this display, select a platform, right-click on another and select “Show relative geometry from A to B”. From the platform browser this can be done most easily by left clicking on the first platform, and ctrl-right clicking on the second. Use the swap button to swap the platforms in the line edits.
Spatial Domains
The tool will automatically select an appropriate domain for the measurements, but these may be changed at any time in the Domain menu.
The measurements for the domains are:
Satellite
Range - The linear distance between the two platforms.
Range Rate - The rate of range change between the two platforms.
Radial - The distance between the platforms on the radial axis.
In-Track - The distance between the platforms on the in-track axis.
Cross-Track - The distance between the platforms on the cross-track axis.
Surface
Range - The linear distance between the two platforms.
Range Rate - The rate of range change between the two platforms.
Bearing - The horizontal angle between the two platforms relative to the source platform heading.
Elevation - The vertical angle between the two platforms.
Down Range - The distance between the platforms on the down-range axis.
Cross Range - The distance between the platforms on the cross-range axis.
Standard
Range - The linear distance between the two platforms.
Range Rate - The rate of range change between the two platforms.
Bearing - The horizontal angle between the two platforms relative to the source platform heading.
Elevation - The vertical angle between the two platforms.
Plotting
Metrics in the relative geometry display may be right clicked on in order to plot them.
Data Displays
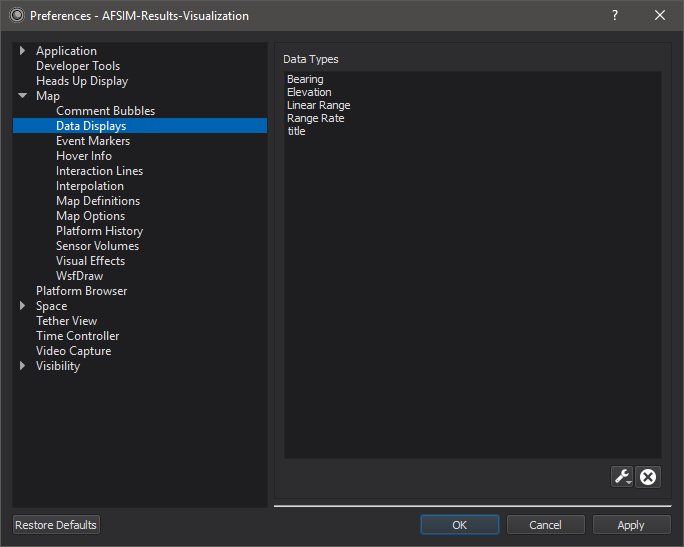
Metrics from the relative geometry may be dragged off of the display and dropped onto the map display, or tether display to create an overlay showing the current value.
Note
The preferences above will populate when the user edits the font size or color of the overlay.