Waterfall Plots - Mystic
The waterfall plot shows for a selected platform, interaction-type, and interactor filter the times at which the interactions were active.
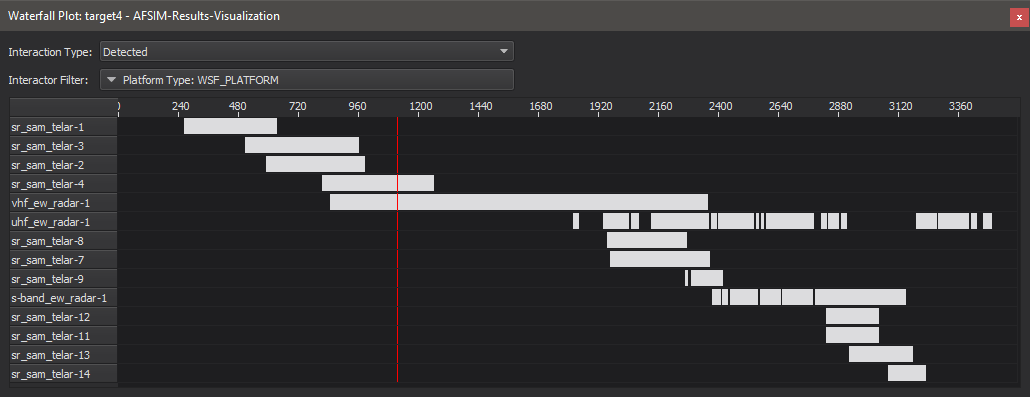
The waterfall plot is accessed by right clicking on a platform. Once the dialog is displayed, the user may select an event-type:
Detected - Shows the periods in which the platform of interest is detected by the interactors.
Detecting - Shows the periods in which the platform of interest is detecting the interactors.
Sensor Tracked - Shows the periods in which the interactors have a sensor track on the platform of interest.
Sensor Tracking - Shows the periods in which the platform of interest has a sensor track on the interactors.
Local Tracked - Shows the periods in which the interactors have a local track on the platform of interest.
Local Tracking - Shows the periods in which the platform of interest has a local track on the interactors.
Jammed - Shows the periods in which the interactors are attempting to jam the platform of interest.
Jamming - Shows the periods in which the platform of interest is attempting to jam the interactors.
The user may also select a filter to apply to the interactors. Interactors may be filtered by side, platform-type, category, or individual name. Right clicking the plot provides an option to export to CSV. Scrolling with the middle mouse button in the plot will zoom in or out on the cursors location.
The plot is only aware of data that is paged in at the time it was invoked. If a different time period is needed the time controller may be manipulated to catch the area of interest, or the memory preferences may be altered.