Map Layer Manager
The map layer manager is accessible from the View menu. The browser may be docked in the left or right docking areas of the main window or be free-floating.
The plus button on the browser allows the addition of new map layers. There are two major categories of map layers:
 Vector layers from ESRI shape files (.shp)
 Image layers from images files (.tif, .tiff, .jpg, .jpeg, .png, .bmp)
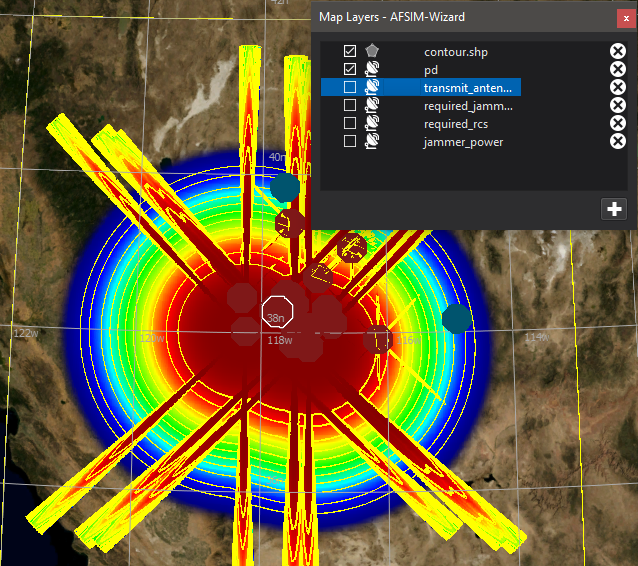
Once a layer is loaded, it will show in the managers list, with a check-box to toggle visibility, and a close button to remove the layer.
When loaded a image layer, three things may happen:
- The image may not contain geographic tags, in which case a dialog will ask for the latitude/longitude constraints of the image.
- The image may contain geographic tags (a geotiff), in which case the image will load in the proper location.
 The image may contain geographic tags and sensor_plot tags, in which case the image will load in the proper location, and apply a color-gradient to the data’s range. Sensor plot images may also contain multiple layers of data.
Only one sensor plot image may be visible at a time.
Right clicking on a vector layer will give options to change the color of the displayed layer.
Right clicking on a image layer will give options to change the opacity of the displayed layer.
Right clicking on a sensor_plot image layer will, in addition, give the option to change the data range of the color mapping or change the color gradient.